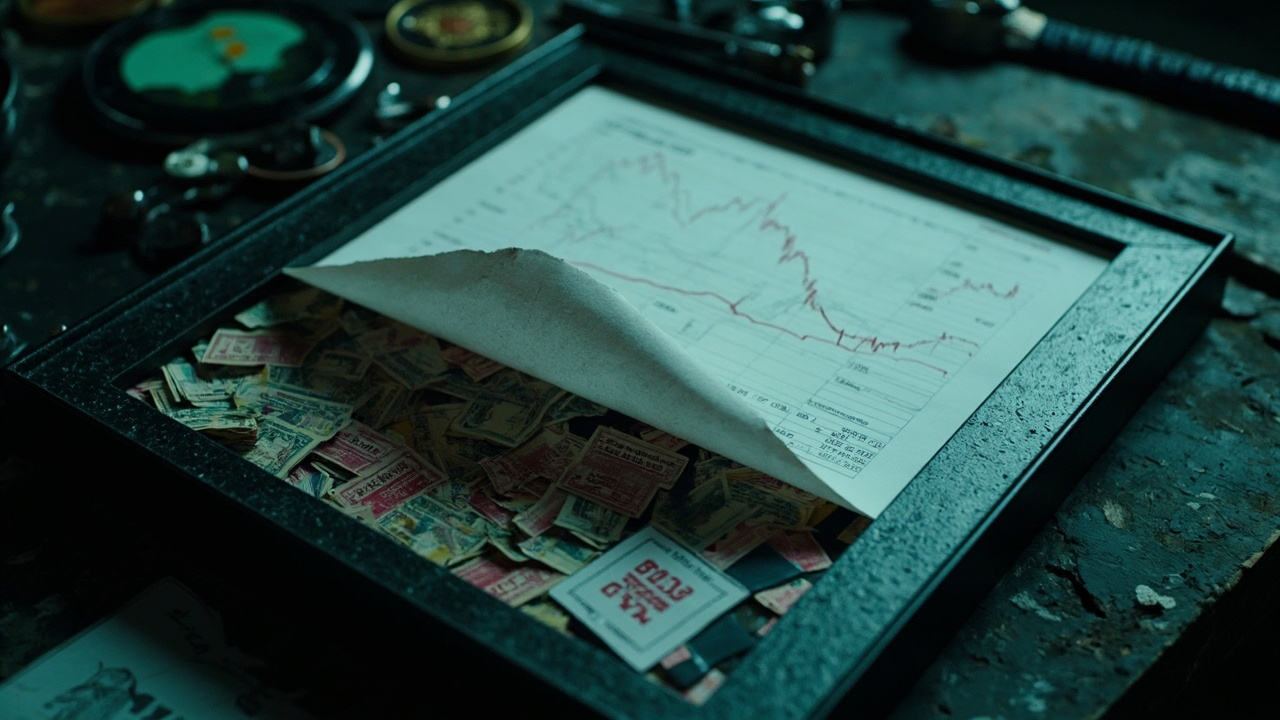
Evidence vs. Receipts
The crypto trading industry has a track record problem, and it's not the kind you can screenshot your way out of.
Every Telegram group has a pinned P&L. Every product page has a chart with an arrow pointing up. Every pitch deck has a "consistent returns" graph that conveniently ends in the present tense. None of these are evidence. They're receipts — fragments someone chose to show you, framed by someone with an incentive to make the fragments look good.
A real track record isn't a chart. It's a dataset. And the gap between the two is where retail capital goes to die.
The Receipt Problem
There's a specific shape to a fake-or-curated track record. You'll recognize it once you've seen enough.
The equity curve is too smooth. Real trading has ugly weeks. Real trading has a Tuesday where you lose 4% on a news wick, recover by Thursday, and give half of it back Friday. Real trading has drawdowns that don't photograph well. If the curve you see looks like a hedge fund's quarterly report, ask what got edited out.
The win rate is suspiciously round. "Consistent 80%+ win rates" are the crypto equivalent of a car that gets 200 mpg. Not impossible, but the explanation usually involves a stop loss so tight it never survives a real spread, or a sample so small that two outliers swing the number.
The strategy description is a feature, not a test. "We use RSI, MACD, and support/resistance" tells you nothing falsifiable. A strategy you can't lose is a strategy that can't be checked. The moment someone shows you their record, the next sentence should be: here are the rules that produced it.
The starting and ending dates are strategic. Showing you January 2023 through May 2024 — the bottom of the bear to the top of the bull — is a receipt, not evidence. Anyone with a buy-and-hold thesis looked brilliant over that window. The real question is what happened in the months they chose not to show.
What Evidence Actually Looks Like
Evidence has a different texture.
Every trade is timestamped and tied to a verifiable venue. Exchange trade IDs, on-chain transaction hashes, signed payloads — something a third party can replay and confirm. If you can't point to a public source for a fill, you don't have a trade. You have a claim.
The dataset includes losses. Not "small losses" or "managed drawdowns" — actual losing trades, with the same level of detail as winners. The ratio of winners to losers is visible. The distribution of outcomes is visible. If a vendor's record shows you 47 winners and 3 losers, ask why the math works out the way it does.
The methodology is reproducible. Someone reading the rules should be able to identify, in advance, what trades the system would take. Backtests are fine. Forward tests are better. Live execution on a public ledger is best. The hierarchy matters, and the vendor should be telling you where they sit on it.
The equity curve shows the pain. Drawdowns are labeled. Losing streaks are visible. There's an honest accounting of time spent underwater. If the chart looks like a ski slope going up, that's the first thing to be suspicious of — because even the best trend followers have months where the model is wrong.
Sample Size Is Not a Vibes Question
The crypto industry throws around "track record" the way high schoolers throw around "experience." It doesn't mean what they think it means.
A hundred trades is the floor for statistical honesty, and even that's thin. Below that, you don't have a track record; you have an anecdote. A vendor with sixty wins and a glowing chart has, generously, a sample. They do not have evidence that the strategy will work in the next regime.
The bigger problem is that most retail-facing track records fail the base-rate test. Suppose a vendor shows you 80% wins over 100 trades. That's not even that impressive as a baseline — but it gets worse when you ask: out of how many attempts? If they ran the strategy 50 times in 2024 and showed you the one that worked, you don't have an 80% strategy. You have a selection effect.
This is the survivorship bias problem in its purest form. You only ever see the strategies that didn't get killed. The 49 others — the ones that hit max drawdown, the ones whose edge decayed, the ones whose market structure stopped working — those don't have marketing pages.
Drawdown: The Number Nobody Wants to Show
ROI is the headline. Drawdown is the truth.
A strategy that returns 50% a year with a 40% max drawdown is a fundamentally different product than one that returns 40% a year with an 8% max drawdown. Most buyers can't tell the difference because most buyers are shown the first number and not the second. That's a feature of the marketing, not the strategy.
Two numbers to demand:
Maximum peak-to-trough drawdown, not the average. Average drawdown is a comfortable number. Max drawdown is the number that determines whether you actually hold through the bad times. If the vendor doesn't publish it, that's a tell.
Recovery time. How long did it take to get back to the previous equity high? Six weeks is fundable. Six months is psychologically fatal for most retail accounts. Most screenshots are framed to make recovery look instant. The path through the valley is the part that actually matters.
There's a current example worth pointing at. OI-weighted funding just spiked to +4.5% with longs paying shorts across major perp venues, per BullSpot's market report — the kind of overleveraged setup where a flush wick tends to clear out crowded positioning before any continuation. A track record with no drawdowns during a setup like this is either lying or trading something else entirely.
The Survivorship Question
If you're evaluating a vendor, ask what their closed accounts look like.
Not the live, marketed ones. The closed ones. The accounts that hit their risk limits. The accounts that were abandoned during a drawdown. The accounts that the vendor quietly stopped talking about when the strategy stopped working.
This is hard to get answers to. It's also the most important question. A vendor with a perfect roster of "live" track records has done a lot of filtering to get there. A vendor who shows you their graveyard — and can explain what they learned from each corpse — is the one whose next strategy you'll actually trust.
The crypto-specific wrinkle is the market itself. Tokens get delisted. Liquidity disappears. Correlations break. A strategy that posted 90% wins on a basket of 2021 altcoins can't be re-tested against that basket in 2026 because those books don't exist. The vendor who shows you a long-term track record across "crypto" without telling you which markets the fills came from is hiding the most important variable in the system.
What "Verifiable" Should Actually Mean
A track record is verifiable when an independent third party — not the vendor, not a friendly auditor — can take the claimed P&L and reconstruct it from the raw data.
For a CEX-based vendor, that means published trade logs with venue, timestamp, pair, side, size, and price, plus the wallet or sub-account they traded on. The exchange's own data should match the vendor's claimed numbers, and the vendor should be inviting you to check.
For an on-chain agent, the bar is higher and the verification is cleaner. The wallet is the receipt. Every fill is a transaction. Every P&L line can be reconstructed from on-chain data without the vendor's cooperation. That's the structural advantage of agents that execute on public ledgers — and it's why vendor behavior on-chain tends to look different from vendor behavior on a centralized exchange. The temptation to curate is real in both cases, but on-chain, the data is harder to fake.
BullSpot publishes a verifiable record rather than a curated one — the reasoning being that a track record is only useful as evidence if someone outside the company can check it. That's the standard the rest of the industry should be measured against, even if most vendors fall short.
The Buyer's Checklist
Before you trust a track record, walk through this:
- Can I see every trade, not the selected ones? Including losses, including the bad weeks, including the strategy's worst month.
- Is the data tied to a public source I can independently verify? Exchange APIs, on-chain transactions, signed logs — not screenshots.
- Is the sample size large enough to be statistically meaningful? A hundred trades minimum; more if the strategy has high variance.
- What's the maximum drawdown, and how long was the recovery? Both numbers, not just the headline ROI.
- Is the methodology written down precisely enough that someone else could reproduce the trades in advance? "RSI and support" isn't a rule set.
- Which markets, and over which dates? A track record on illiquid 2021 altcoins is not a track record on 2026 majors.
- What isn't shown? The closed strategies, the abandoned accounts, the version of the system that didn't work. If the vendor can't tell you, ask why.
If a vendor passes five of seven, they're worth a closer look. If they pass all seven, they're an outlier — either genuinely rigorous or very good at looking rigorous. Either way, you've asked better questions than 95% of buyers in this space.
The Takeaway
The cheapest signal in crypto is a chart with an arrow. The most expensive is a verifiable track record with documented losses.
Stop confusing them. Demand the second one, and treat the first one as marketing copy. Anyone can produce a screenshot. Very few can produce evidence — and even fewer will show you the trades they lost.
When you find one who does, hold onto them. Everyone else is selling you a receipt.
Source: BullSpot market report (Fresh report: generated this cycle)
Source context: BullSpot report from 2026-09-08T01:56:43.918Z (Fresh report: generated this cycle).